How the results are developed
A platform that tells you where your marketing money should go has to show its work. This is how the numbers on the other pages get made: what goes in, how each one is checked, and what happens when something can't be known yet.
What goes in
The data your business already has. Retail sales and velocity by retailer, from syndicated sources such as Circana or IRI or from your retailers' own portals. Household panel data on who buys and whether they come back, from Numerator or similar. Platform reporting from every paid channel. Brand tracking and search interest. Your media plans and spend. Nothing is required that you would have to buy for the purpose; where a source is missing, the platform says so and works with what is there.
Three readings of every channel
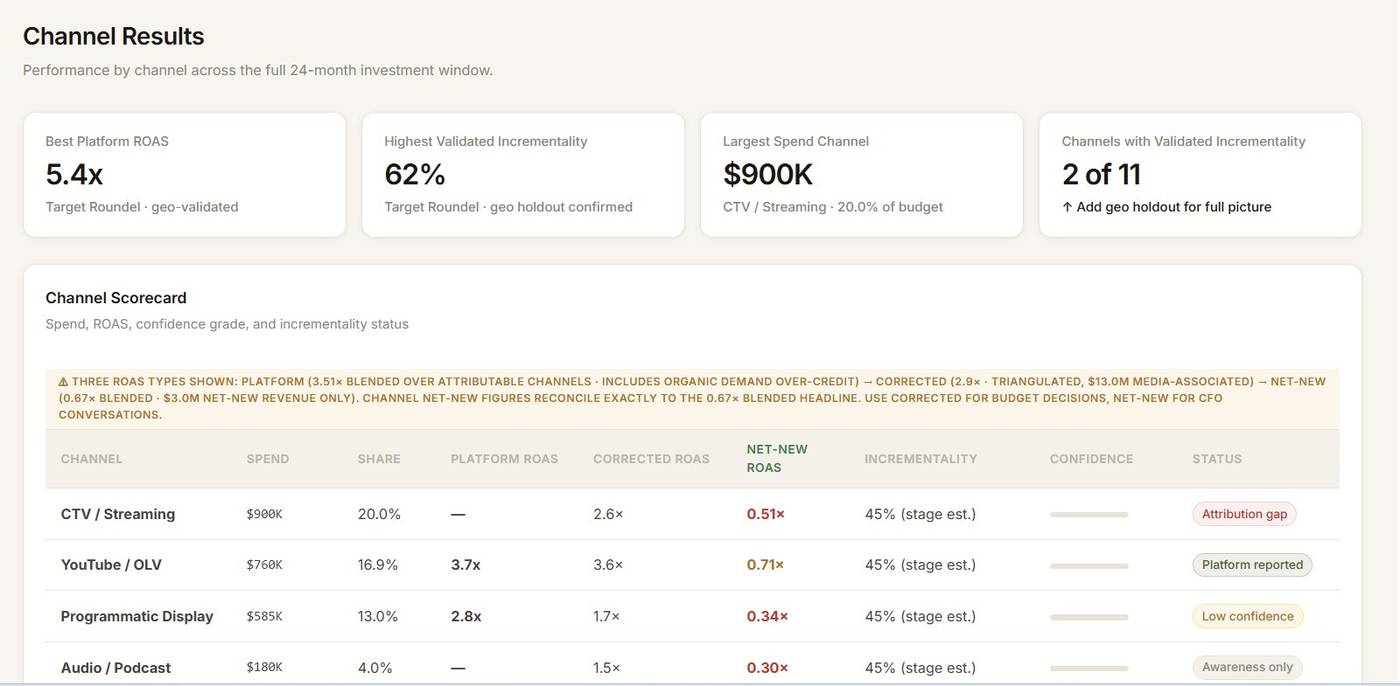
Platform-reported is what the ad platform claims. It is useful for the media team's day to day and almost always generous, because platforms take credit for demand that already existed. Corrected is the platform number adjusted by evidence from outside the platform, cross-checked across attribution, marketing mix modelling and geo holdout tests where they exist; this is the number for budget decisions. Net-new is only the revenue that would not have happened without the spend; this is the number for the CFO conversation. All three sit side by side, so nobody has to argue about which one is real. They answer different questions.
Marketing in context
Revenue is broken out from the base business, meaning distribution, product and repeat buyers, through organic and earned, to marketing-assisted and net-new. Marketing's share is sized against the whole. It is usually smaller than the platforms say and larger than finance assumes.
Confidence, and ranges
Every channel carries a confidence grade based on how it was validated: a geo holdout test, a modelled estimate, or platform reporting alone. Forecasts are shown as ranges, a likely middle with a band around it, rather than single numbers, because a single number is a promise nobody can keep.
When something can't be known yet
The platform says so, in the open. “Two of eleven channels validated; add a geo holdout for the full picture” is the kind of line you will see. The recommendation that follows is to test, not to guess.
How it stays honest over time
Each month the data refreshes, the forecasts are compared with what actually happened, and the assumptions that missed get revised. The readout includes what changed and why.